As of writing, it appears we’re heading into the start of meteorological summer (June 1) with a wet meteorological spring on the books. Meteorological spring will end with over 15 inches of rain from March 1 through the end of May, making it the 24th wettest Spring on record for Indianapolis. Keep in mind, records for Indianapolis go back 154 years, so that’s 24th out of 154 springs, which is impressive. Even more noteworthy, however, is what seems to be Fort Wayne’s 4th wettest meteorological spring on record since 1897, also with over 15.6 inches of precipitation.
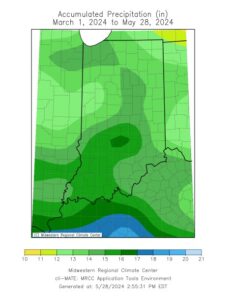
- Figure 1. Accumulated Precipitation for March 1, 2024-May 28, 2024
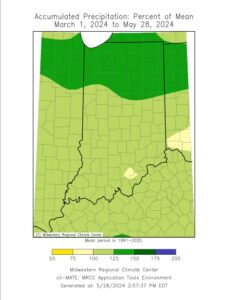
- Figure 2: Precipitation Percent of Mean for March 1, 2024-May 28, 2024
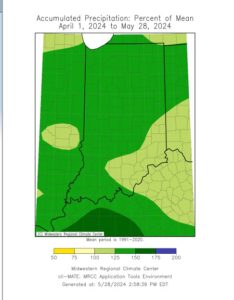
All in all, much of the state looks to end meteorological spring with widespread accumulations of over 15 inches. Some spots, especially in central and southern Indiana, got above 16 inches (Figure 1). However, most of this fell after April 1, and this is displayed by the percent of mean precipitation, which is 100 percent of mean in central and southern Indiana and up to 150 percent of mean for northern Indiana since March 1 (Figure 2). However, when using April 1 as a start date, this switches to 125-150 percent of mean statewide, with the exception of southeast Indiana (Figure 3). For those rain-weary folks, as of May 29, the 8-14 day precipitation outlook from the National Weather Service’s Climate Prediction Center (CPC) has all of Indiana leaning toward near normal or even slightly below normal precipitation through June 11. There is a slight signal of 50-65 percent chance of above normal precipitation again for southern Indiana heading through June 21.
- Figure 3: Precipitation Percent of Mean for April 1, 2024-May 28, 2024
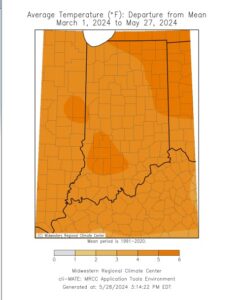
- Figure 4: Average Temperature, Dep. From Mean for March 1, 2024-May 27, 2024
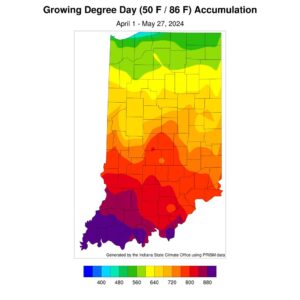
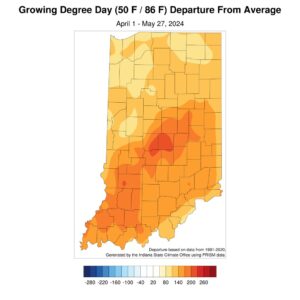
Temperatures have also been above normal, with northeast Indiana and a pocket of southwest Indiana up to 5 degrees above normal while most of the rest of the state hovered 4 degrees above normal since March 1 (Figure 4). It looks like the CPC is predicting near normal temperatures for most of Indiana through June 10, with a slight chance of above normal temperatures through far northern Indiana. As for growing degree days, they are chugging along with major accumulations south of Indianapolis, much of which is well above normal (Figures 5 & 6).
- Figure 5: GDD Accumulation for April 1-May 27, 2024
- Figure 6: GDD Departure from Average for April 1-May 27, 2024
