While our daytime highs across the state were in the upper 70s, our nighttime lows have been in the 30s (even into the upper 20s) in some places. This could get us thinking about the timing of the first frost and freeze events of the season, when the 7-day average 4-inch soil temperature falls before 50°F, and the viability of our home’s furnace. The Midwestern Regional Climate Center (MRCC) can help provide historical climatologies of the first two of those three. It keeps a positive thought for the third item!
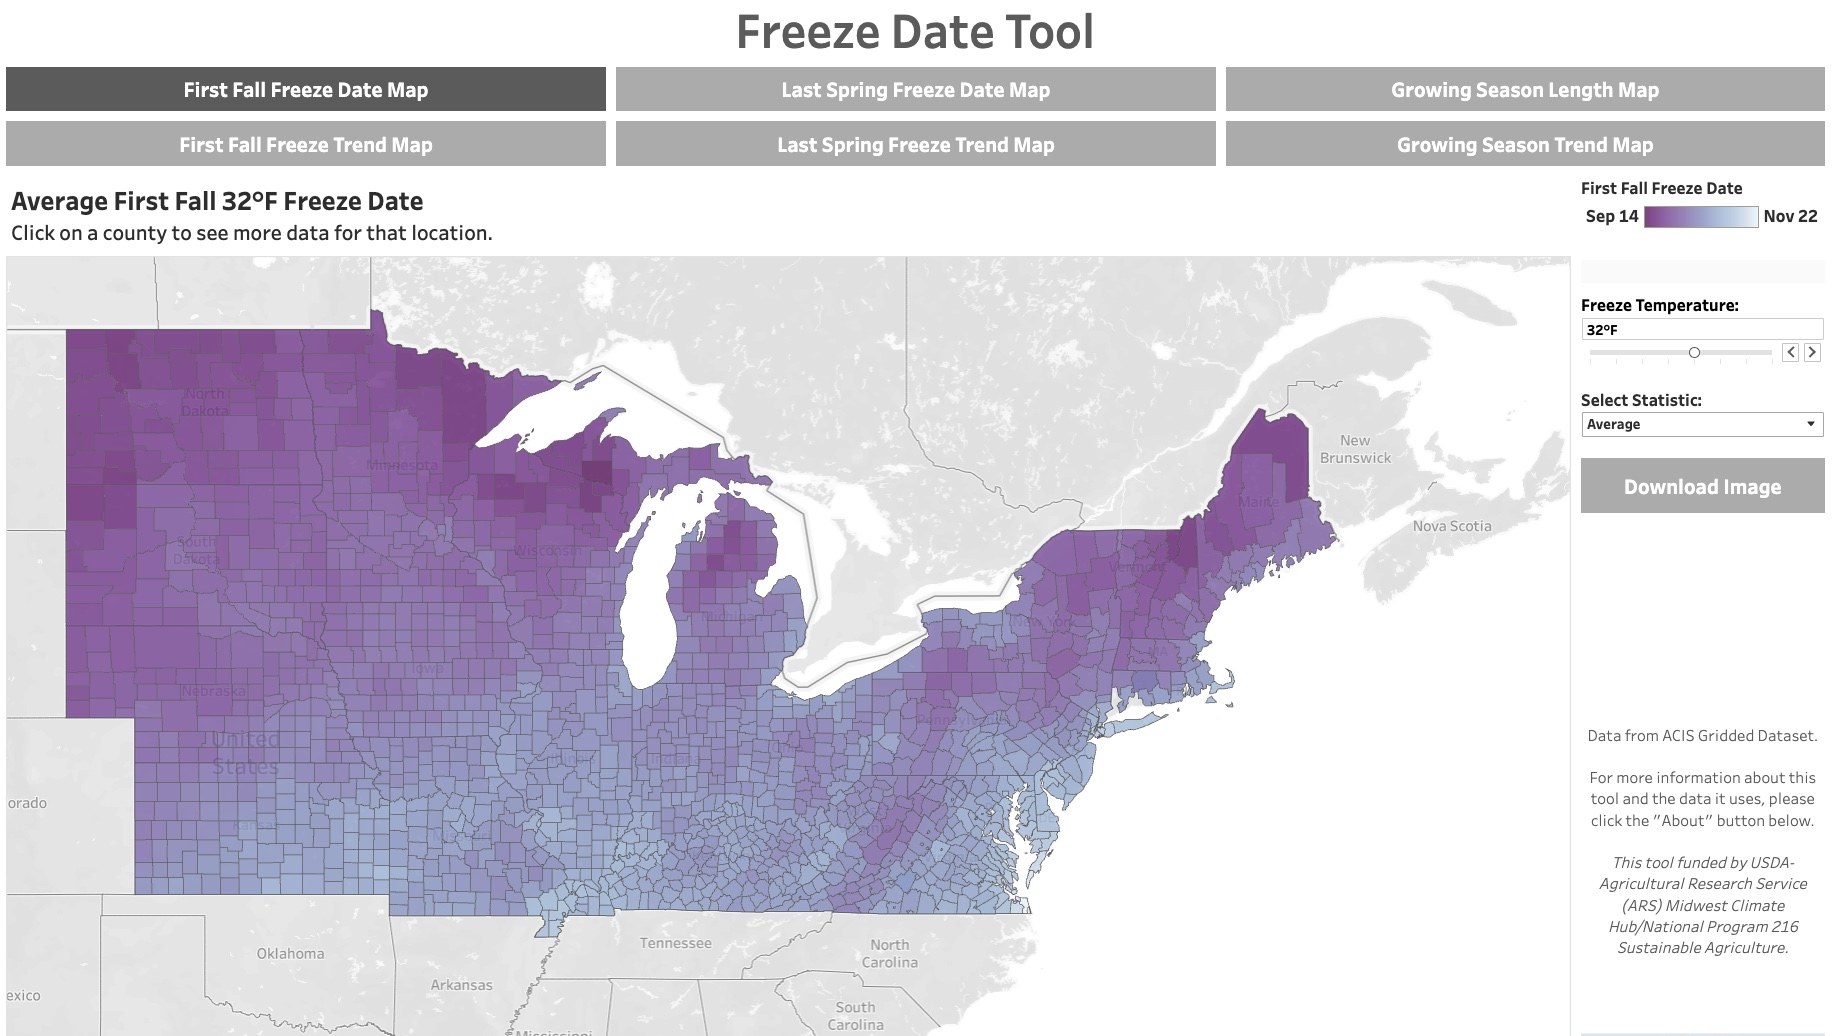
The typical date of the first freeze event in your area can be explored using the MRCC’s Freeze Date Tool (Figure 1). This tool uses county data to illustrate the earliest, average, latest, and other climatalogical timing of the first fall and last spring dates of when temperature fell below or above certain temperatures thresholds, respectively. Users can choose temperature values ranging from 20°F to 40°F and then mouse over their county of interest to see historically when those temperature thresholds were crossed. Clicking on a county will take the user to a new screen that will show the historical dates from 1950-2023 for all temperature threshold options. Since the date of the last spring freeze and first fall freeze can often be used to define the length of the growing season, users can select the “Growing Season Length” tab of the tool to see how the growing season length has varied for their location over the years using user-defined temperature thresholds.
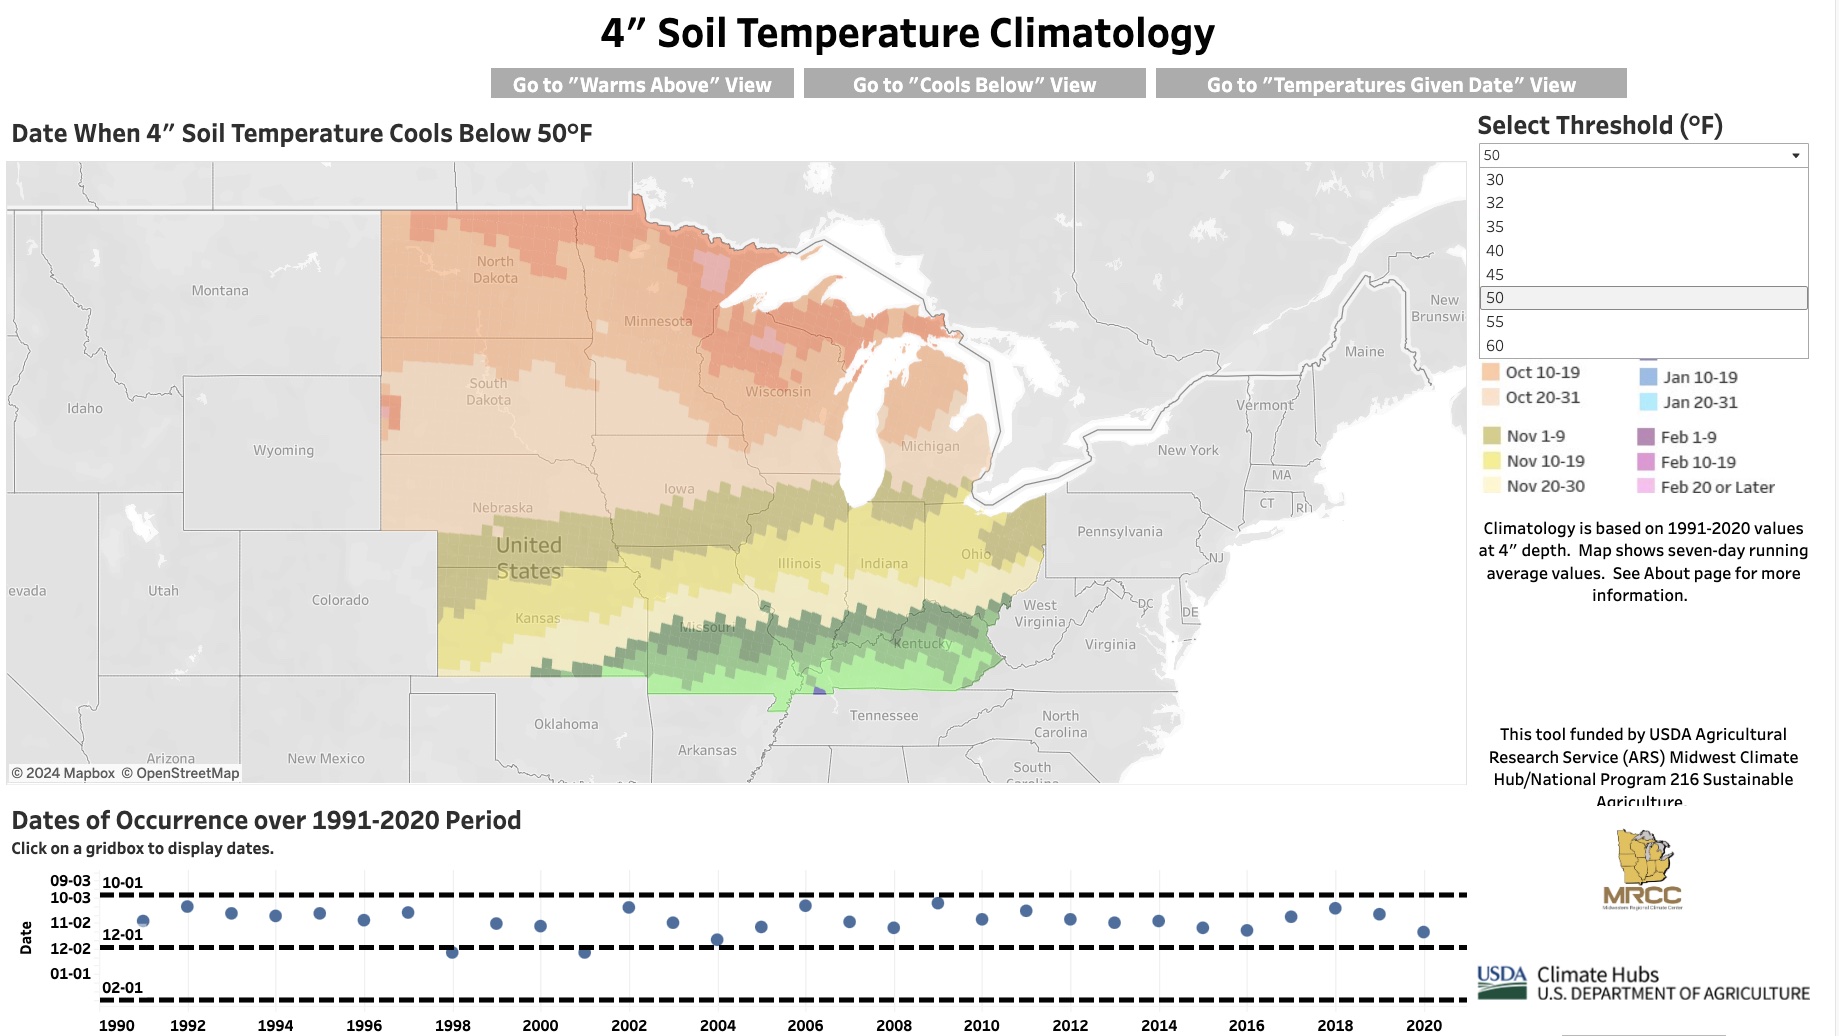
Another online tool users may find interesting is the MRCC’s Soil Temperature Climatology Tool. (Figure 2). Using gridded data from 1991-2020, users can identify dates when the 7-day average 4-inch soil temperature either cools below (e.g., late fall) or warms above (e.g., spring) particular temperature thresholds. Knowing the climatology of these dates can provide decision support for agricultural activities such as planting and nutrient applications as well as other soil temperature-dependent events. Users can also leverage this tool to explore the typical 4-inch soil temperature values on a particular date. Temperature thresholds that users can select range from 30°F to 60°F.
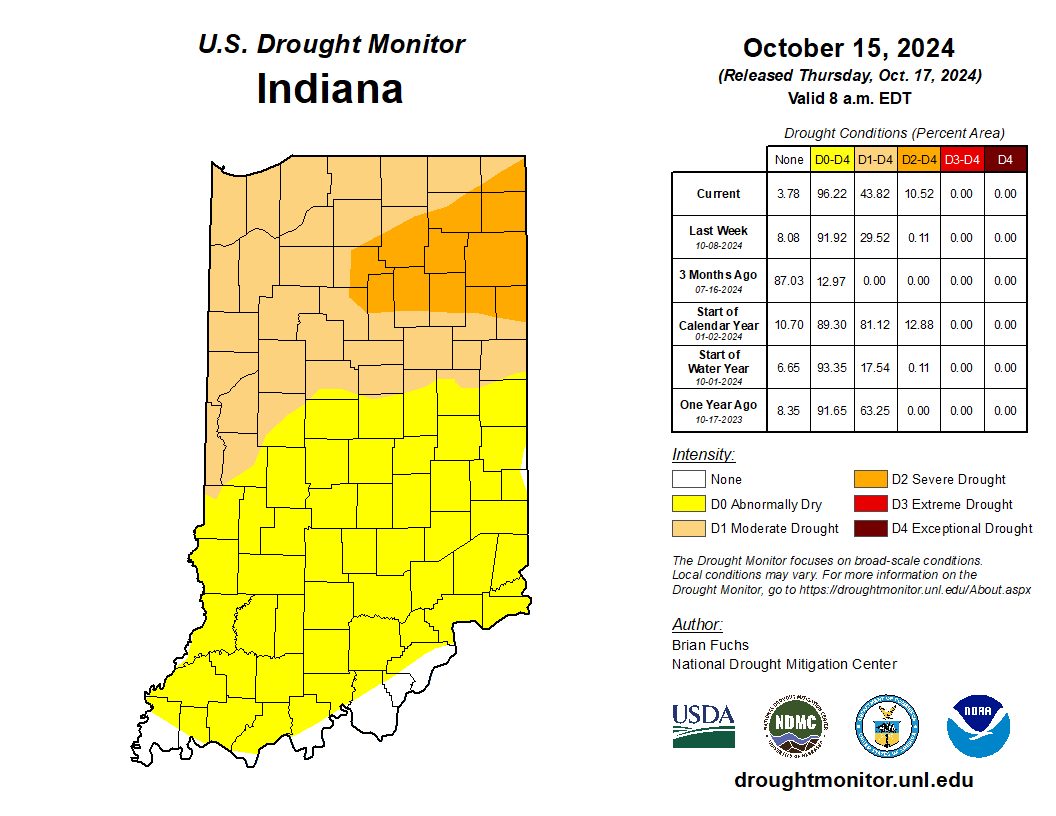
Indiana seems to be back in a relatively dry pattern and unfortunately things look like they’ll stay that way for a while. This has led to the majority of Indiana being classified as at least Abnormally Dry (D0) to some areas in northwest Indiana in Severe Drought (D2) according to the U.S. Drought Monitor (Figure 3). The 7-day precipitation forecast (through October 24th) is predicting little-to-no rain whereas the 8-to-14-day climate outlooks (October 24th-30th) are slightly favoring above-normal precipitation — which is more likely to occur near the end of that period (e.g., end of October) rather than earlier. Temperatures are expected to warm up soon and stay above-normal for the next few weeks.
-
- Figure 1. Screenshot of MRCC’s Freeze Date Tool main page.
-
- Figure 2. Screenshot of MRCC’s 4-inch Soil Temperature Climatology Tool main page.
-
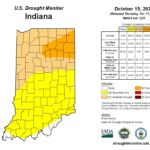
- Figure 3. U.S. Drought Monitor conditions through October 15, 2024.